Campaign analytics: what each number means
Read the Analytics tab of a campaign and the Home dashboard: profiles visited, invites sent, acceptance rate, LinkedIn replies, email opens, bounces and task results.
Updated October 13, 2026
On this page
The Analytics tab of a campaign shows what the campaign did over a date range: profiles visited, invitations sent and accepted, LinkedIn messages and replies, emails sent, opened and replied, and every action with its result. The Home page gives the same kind of numbers for all your campaigns together.
Choose the period
Open a campaign and click Analytics. By default it shows the last 10 days. Pick a range in the date picker, or click 7 days, 30 days or 90 days.
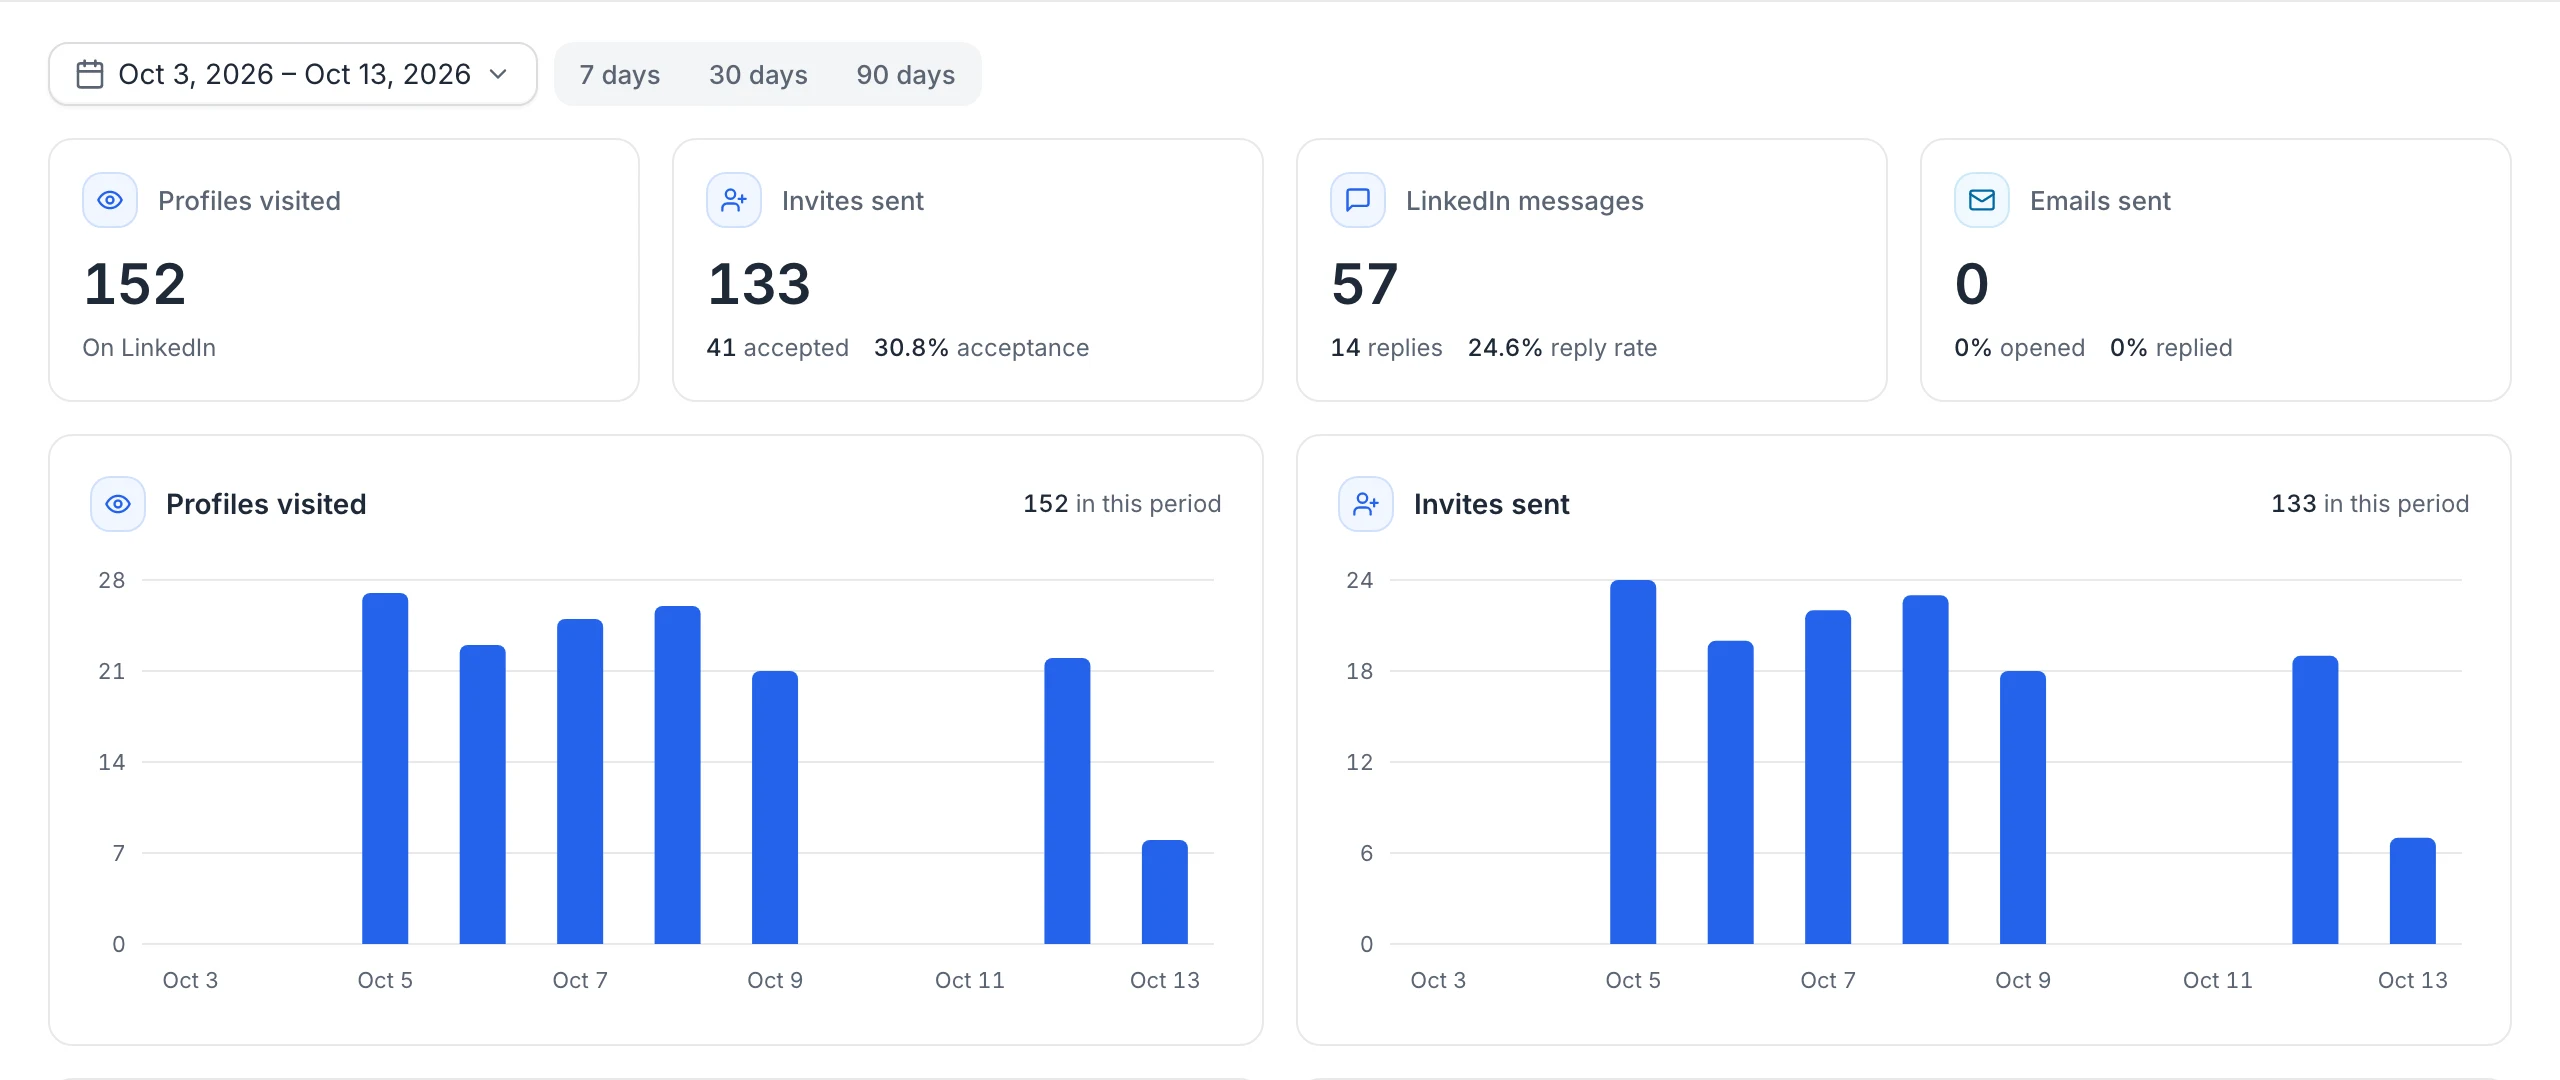
Summary cards
| Card | What it counts |
|---|---|
| Profiles visited | Profile visits done in the period. |
| Invites sent | Connection requests done in the period. A lead who was already a connection, or already had a pending invitation, counts as done. |
| accepted | Leads of this campaign whose acceptance was detected in the period. |
| acceptance | Accepted ÷ invites sent in the period. |
| LinkedIn messages | LinkedIn messages sent in the period. |
| replies | Leads of this campaign who replied on LinkedIn in the period. |
| reply rate | LinkedIn replies ÷ messages sent or invitations accepted in the period, whichever is higher. |
| Emails sent | Emails sent in the period. |
| opened | Share of the emails sent in the period that were opened (a click counts as an open). |
| replied | Share of the emails sent in the period that got a reply. |
| bounced | Emails that bounced, shown only when there are some. |
Because acceptances and replies are counted on the day they happen, a short period can include acceptances of invitations sent before it.
Note: As the table explains, "Opens are only detected when the lead's email client loads images." Treat the open rate as an indication. Links in campaign emails are tracked to count clicks; the unsubscribe link isn't.
Activity charts
Four charts show the actions done per day: Profiles visited, Invites sent, LinkedIn messages and Emails sent, with the total "in this period". A chart with nothing to show says, for example, "No invite sent".
Task results
The Task results table lists "Every action executed in this period, with its result": the lead (Name), the Step, the Status and the Date. Click a column header to sort.
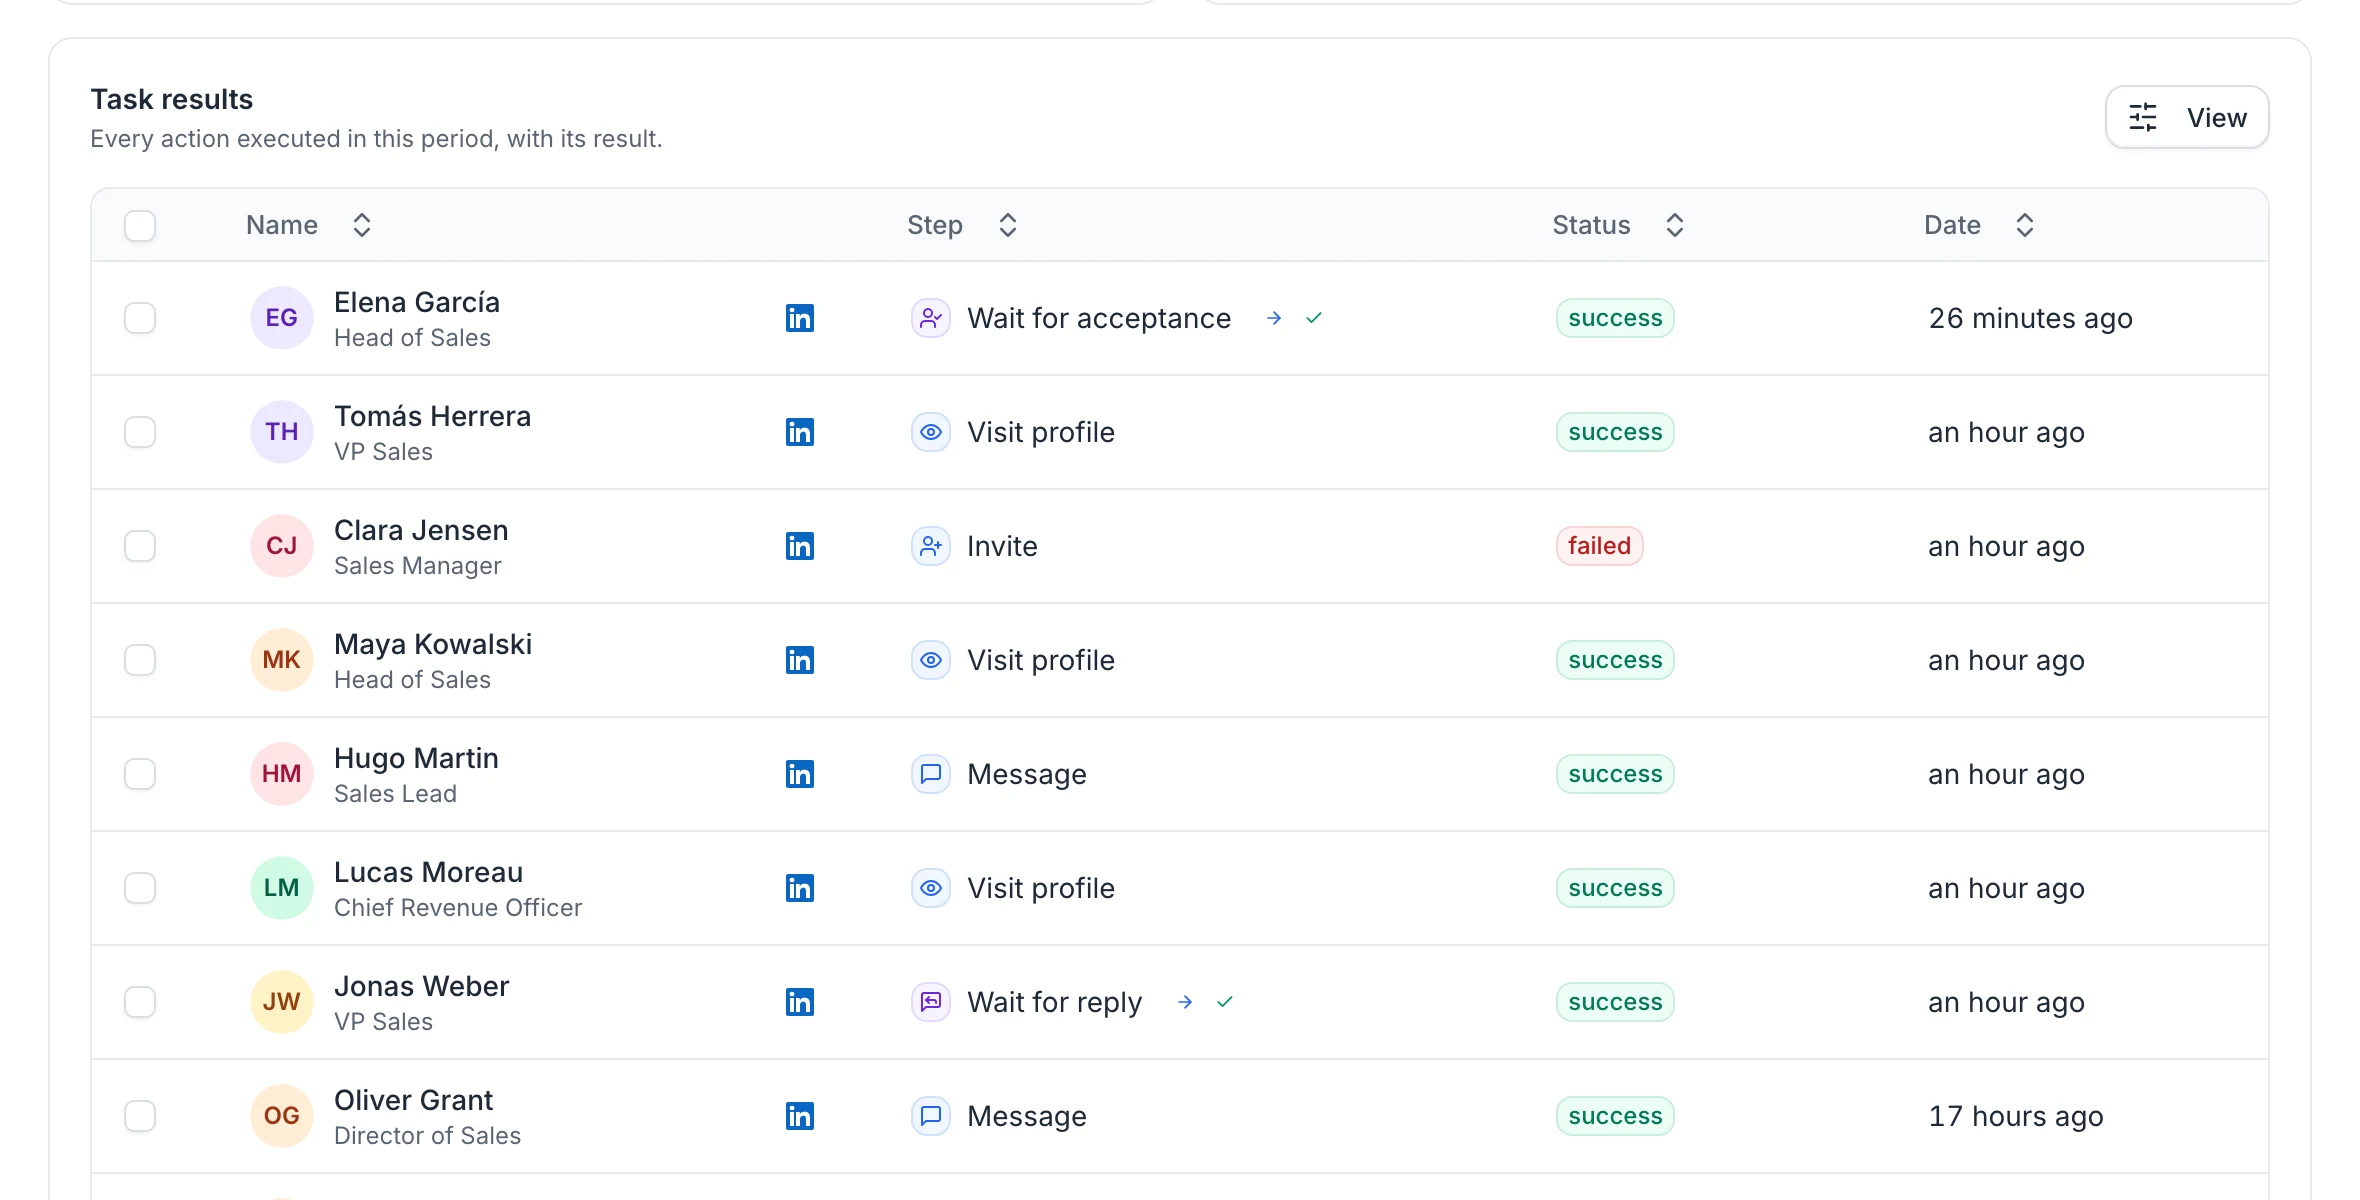
- success: the action was done.
- failed: hover the badge to read why. See Queue and failed actions.
- skipped: the step didn't apply, for example an email to a lead without an address. Hover to read why.
- running: being sent right now.
Next to waits, conditions and filters, a check or a cross shows the branch taken. Hover it for the result, such as "The invitation was accepted", "No reply in time" or "Filter result is true". Next to emails, an icon shows whether the email was opened, clicked, bounced or replied to.
Actions planned for later aren't in this table: see the Queue tab.
Lead counters
The counters of the Leads tab (In progress, Completed, Replied, Accepted…) are totals since the launch, whatever the date range. See Manage campaign leads.
Campaigns list
On the Campaigns page, Leads Reached shows the "Number of leads reached / Total number of leads in the list": leads with at least one completed step, out of the leads of the target list.
Home dashboard
The Overview of the Home page covers all your campaigns (in a team, the team's campaigns) over 7 days, 30 days or 90 days:
- Leads contacted: leads who received at least one invitation, LinkedIn message or email in the period. Below it, the number of invitations sent.
- Acceptance rate: invitations accepted ÷ invitations sent in the period.
- Messages sent: LinkedIn messages plus emails, with the split below.
- Replies: leads who replied in the period, with the reply rate (replies ÷ leads contacted).
The arrows compare with the previous period of the same length. The Activity chart shows Invitations, Messages and Replies per day.
The Campaigns panel shows how many campaigns are running and how many actions are planned in the next 24 hours, with for each campaign its Progress (leads reached out of the leads of its list), Accepted and Replied.
FAQ
Why do Home and Analytics show different numbers?
They don't cover the same scope: Home adds up all your campaigns over the selected days, Analytics shows one campaign over its own date range. The rates also use slightly different bases (for example, the Home reply rate divides by leads contacted).
Are replies from the inbox counted?
Replies are counted when a lead of a campaign writes back on LinkedIn or replies to a campaign email. See Use the inbox.
Was this article helpful?
Related articles
Still need help?
Write to hello@useartemis.co with your account email and what you were trying to do.